Phase 1 (2025) – Spatial distribution and drivers of greening
Act. 1.1 – Uncovering regional-level distribution of greening trends
We analyzed Landsat satellite data from 1984 to 2023 using Google Earth Engine to track long-term vegetation trends. We used Tier 1 surface reflectance images from Landsat 5, 7, and 8, selecting only those with less than 80% cloud cover. Cloud- and snow-affected pixels were removed using the CFmask algorithm. To correct for differences in lighting and viewing angles, we applied BRDF normalization, standardizing reflectance values across time and space. We also used cross-sensor calibration to align reflectance data between the three Landsat missions. For each year, we calculated the maximum NDVI value (NDVImax) during the growing season, based on BRDF-corrected and calibrated red and near-infrared bands. To avoid bias from increasing image frequency over time, we adjusted NDVImax using a pixel-based phenology model. NDVI time series were reconstructed with the HANTS method, and trend analysis was done using an autoregressive model, which accounts for temporal autocorrelation and provides more reliable slope estimates than traditional methods.
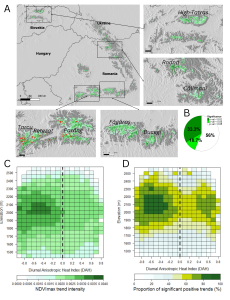
(A) Pixel-level greening trends (NDVImax slope) across the Carpathian Mountains from 1984 to 2023. (B) Approximately 40% of pixels showed significant greening over time. (C) Greening is most pronounced on north-facing slopes between 1800 and 2200 m, highlighting strong topographic and elevational patterns.
Act. 1.2 – Assessing greening trends variability across land cover types
We created a detailed land cover map using Sentinel-2 imagery (2018–2021), focusing on six main types: screes, grasslands, Ericaceae shrublands, Juniperus shrublands, Pinus mugo shrublands, and Picea forests. For each type, we selected 250 training points from homogeneous areas based on aerial images from Google Earth. Using Google Earth Engine, we applied a Random Forest classifier with selected spectral indices (e.g., MNDWI, EVI, NARI, NCRI, CARI) to distinguish between land cover types, especially shrublands. Sentinel-2 data were processed to surface reflectance level, corrected for atmospheric and terrain effects, and cloud-masked using a 20% cloud probability threshold. The imagery was resampled to 30 m to match the resolution of Landsat data used for greening trend analysis.
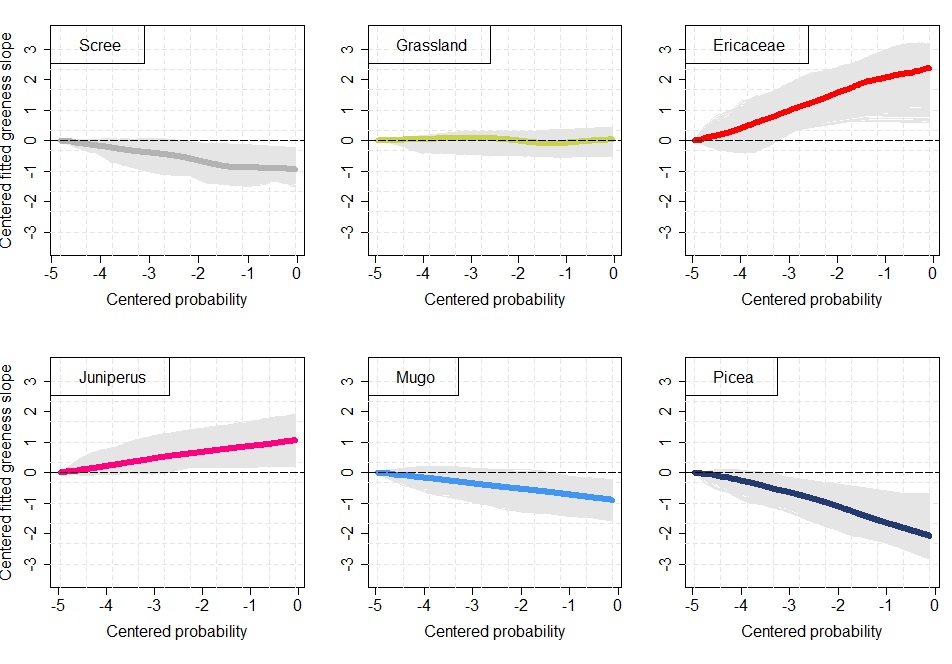
To explore how greenness trends relate to land cover, we used Individual Conditional Expectation (ICE) plots. These show how predicted values change when the proportion of one land cover type varies while others stay fixed. Because land cover types are proportions that always add up to 1, we used compositional data analysis to avoid misleading results. This method accounts for the trade-offs between cover types and reduces problems like multicollinearity. We used the R package ‘Compositional’ to fit a projection pursuit regression, with greenness trend as the response and land cover probabilities as predictors. ICE plots were then generated using log-transformed data to show how each land cover type affects predicted greening.
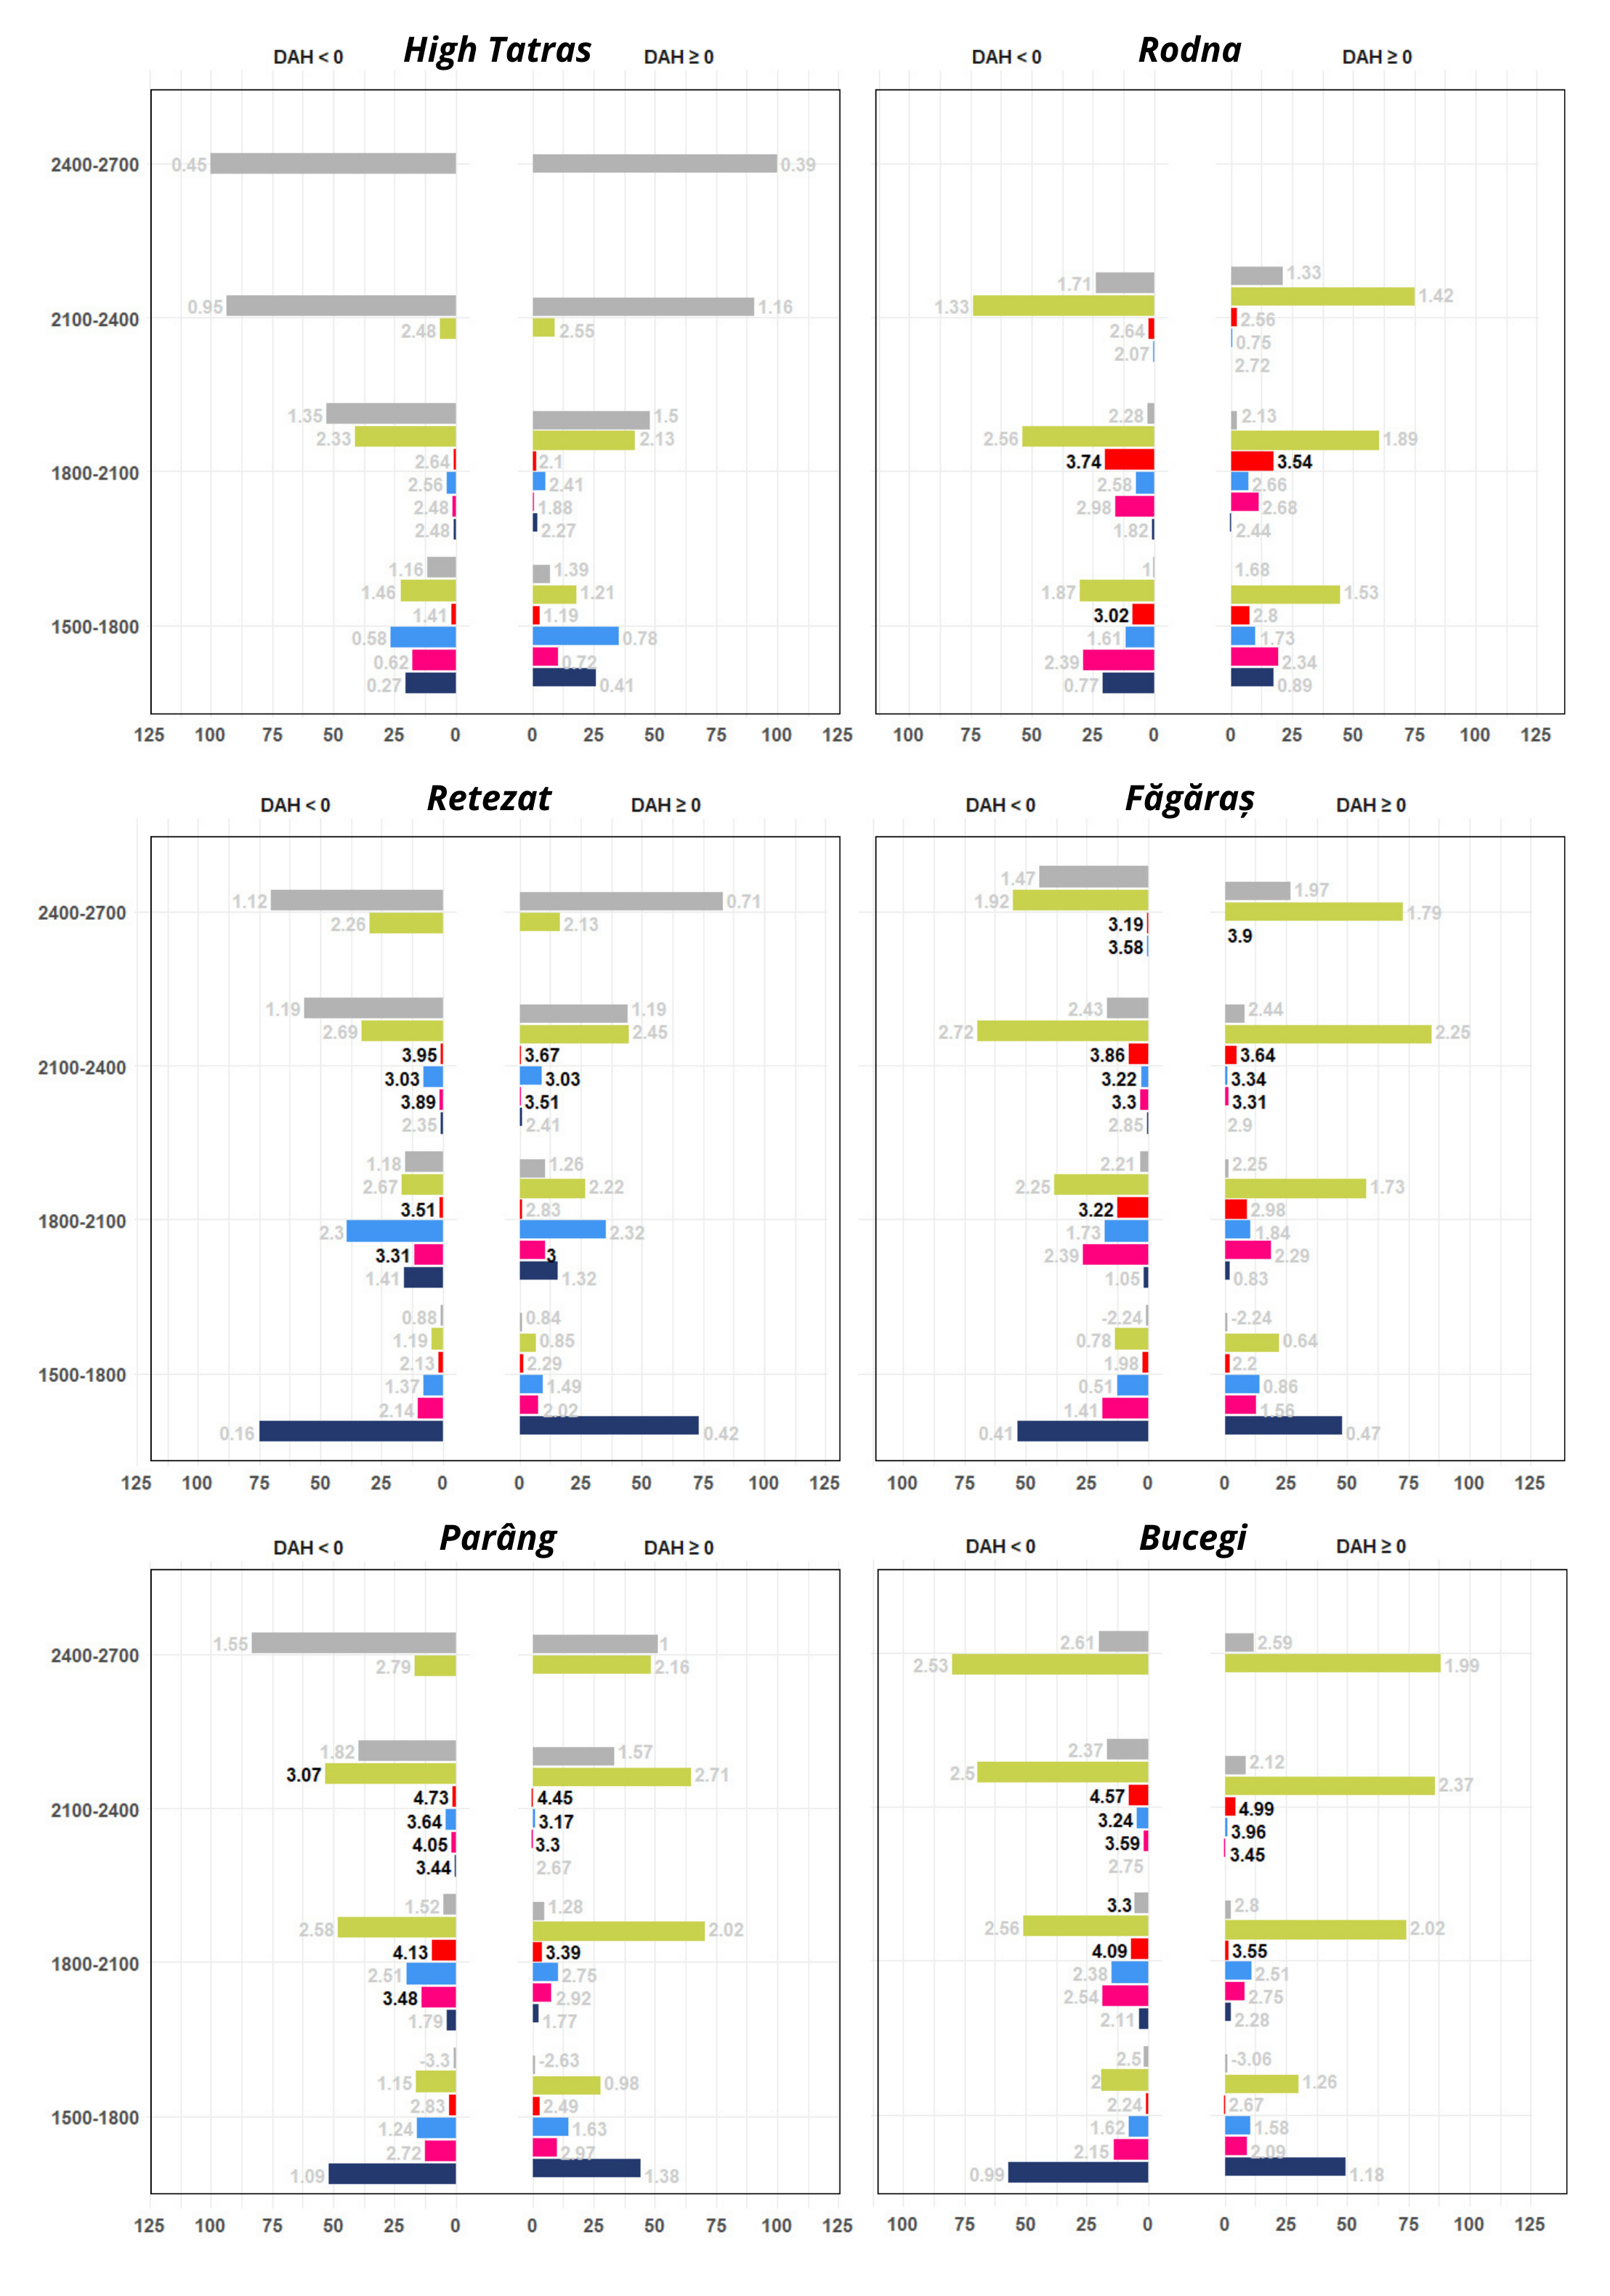
Greening trends were closely linked to land cover. Ericaceous shrublands showed the strongest and most consistent NDVImax increases, especially on north-facing slopes in the Southern and Eastern Carpathians (e.g., Rodna, Făgăraș, Parâng, Bucegi). Juniperus shrublands also showed positive trends, while Pinus and grasslands had more localized greening. In contrast, screes and Picea forests showed little to no greening. ICE plots revealed that pixels with a high probability of Ericaceous or Juniperus cover tended to have stronger greening, though variability within Ericaceae was high. For screes, Pinus, and Picea, higher cover probabilities were linked to lower greening, while grasslands showed neutral responses.
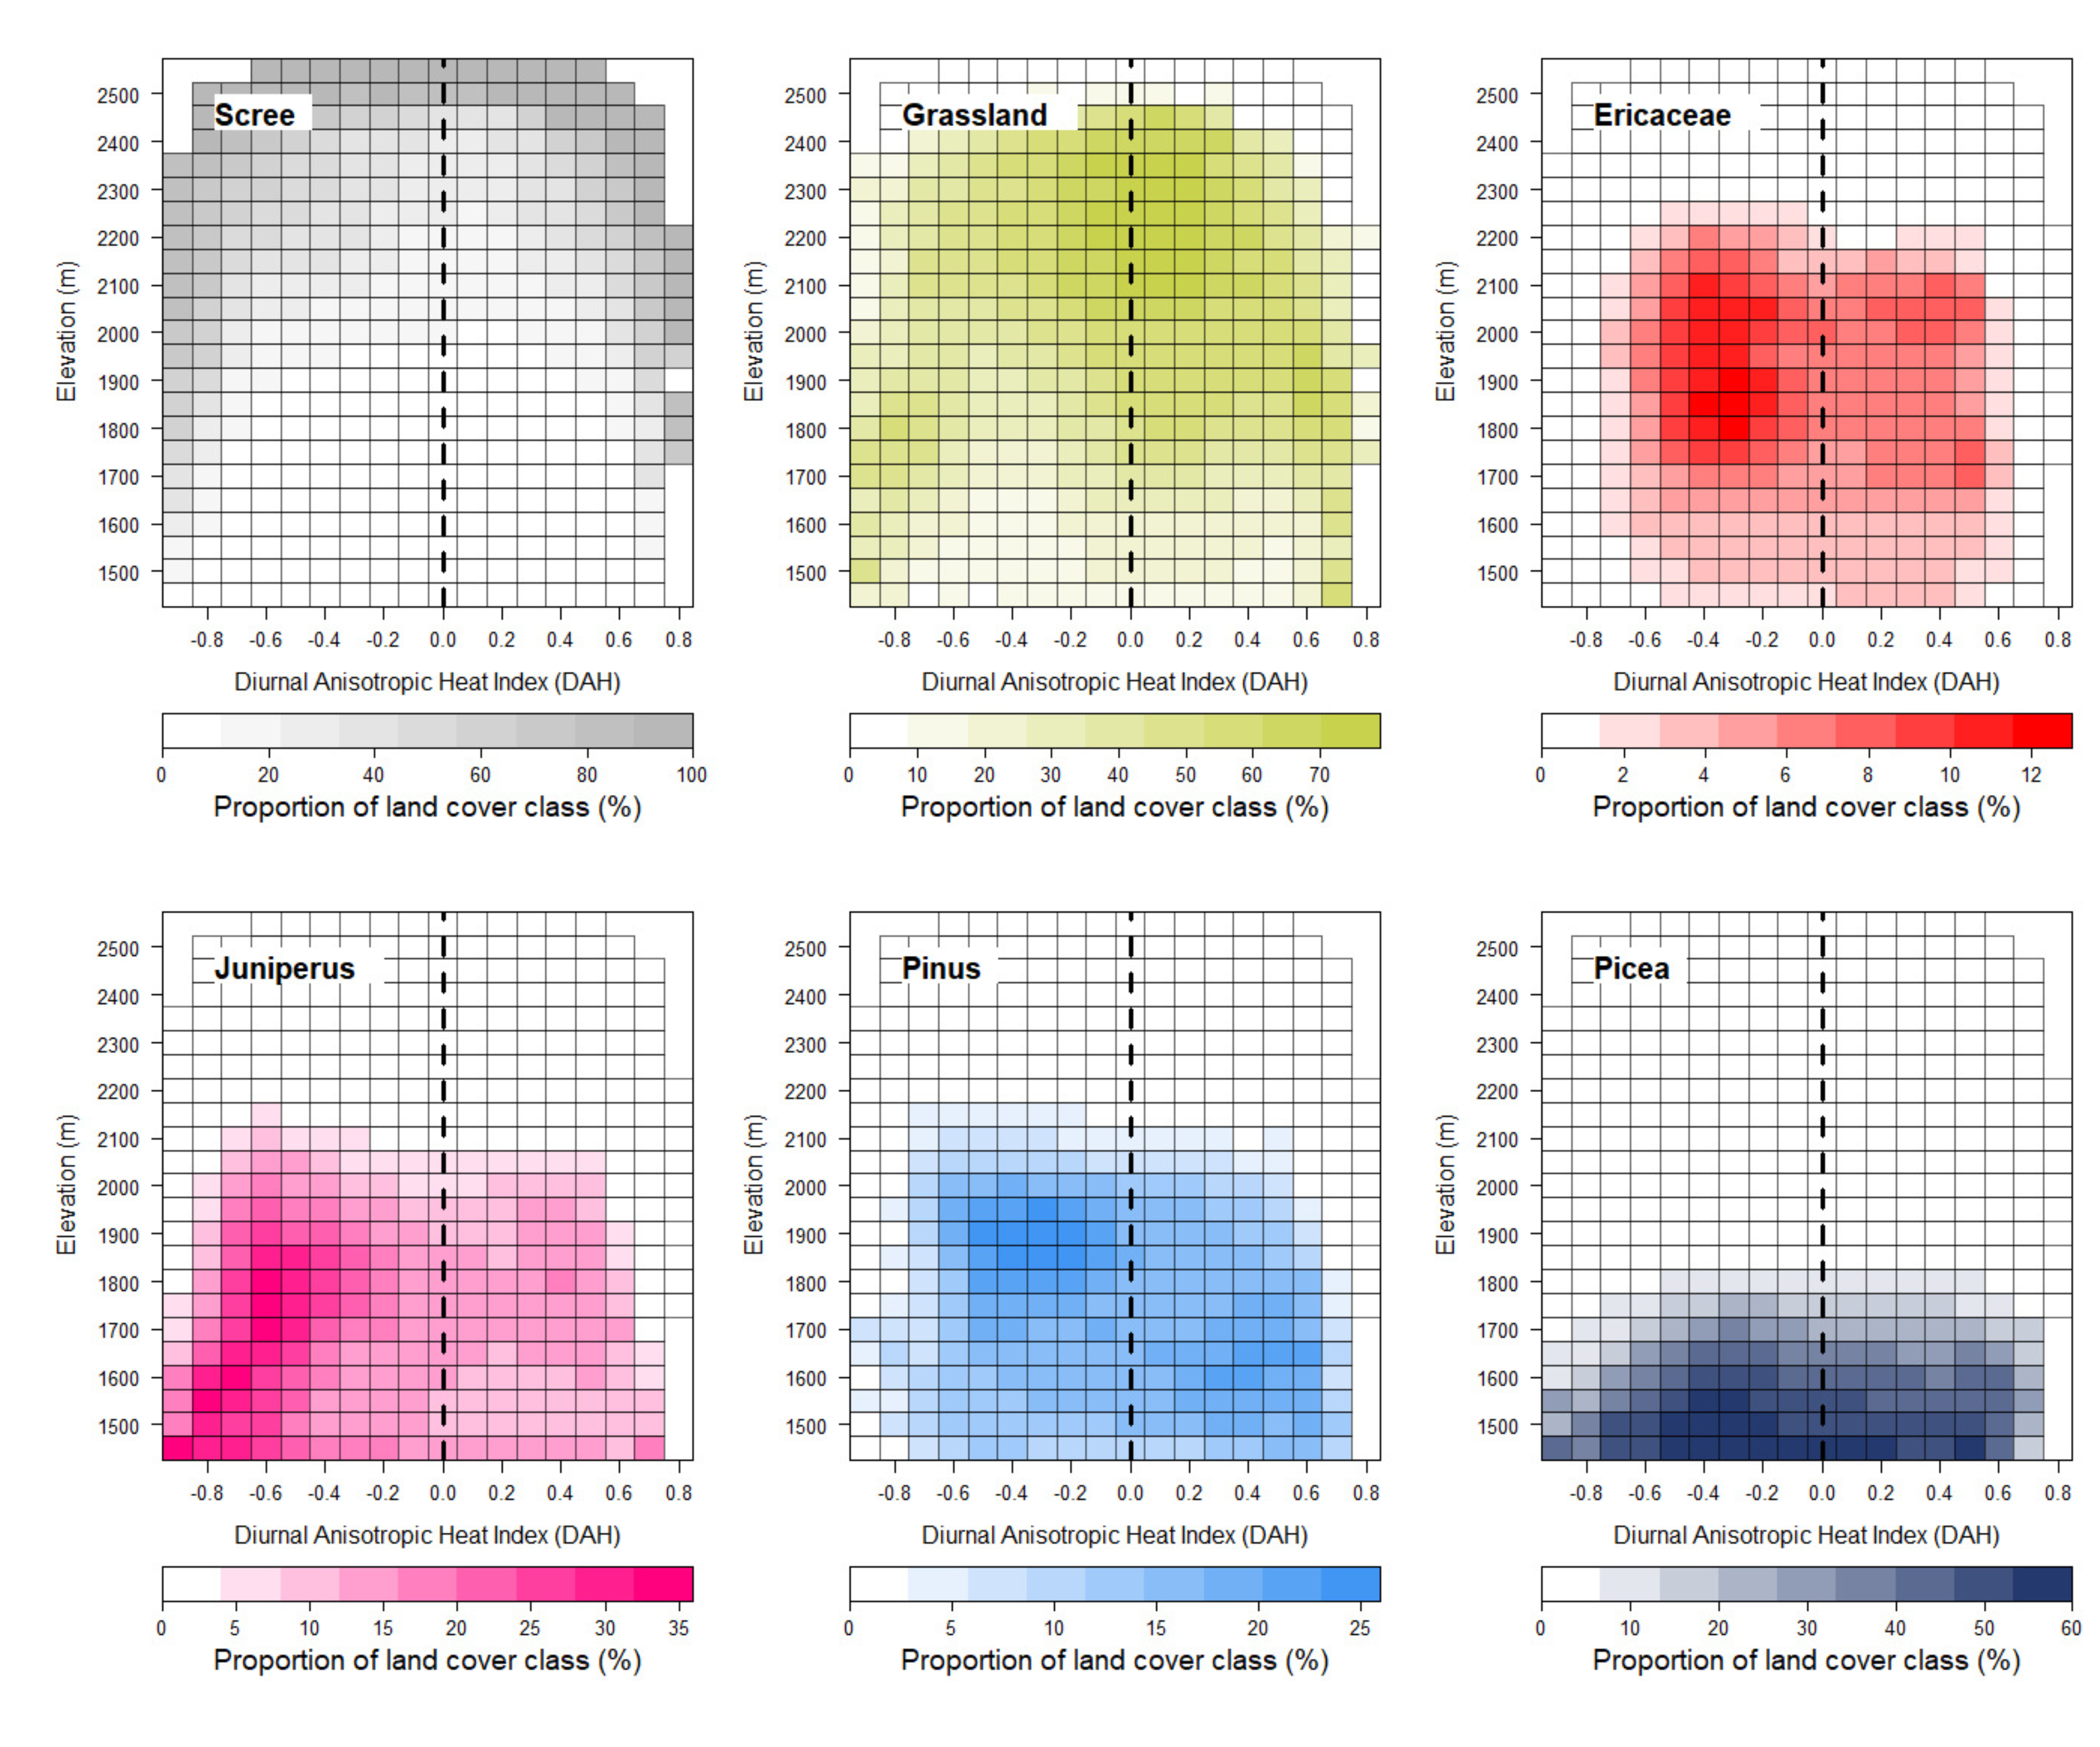
Distribution of the six land cover classes across Diurnal Anisotropic Heat Index and elevation gradients.
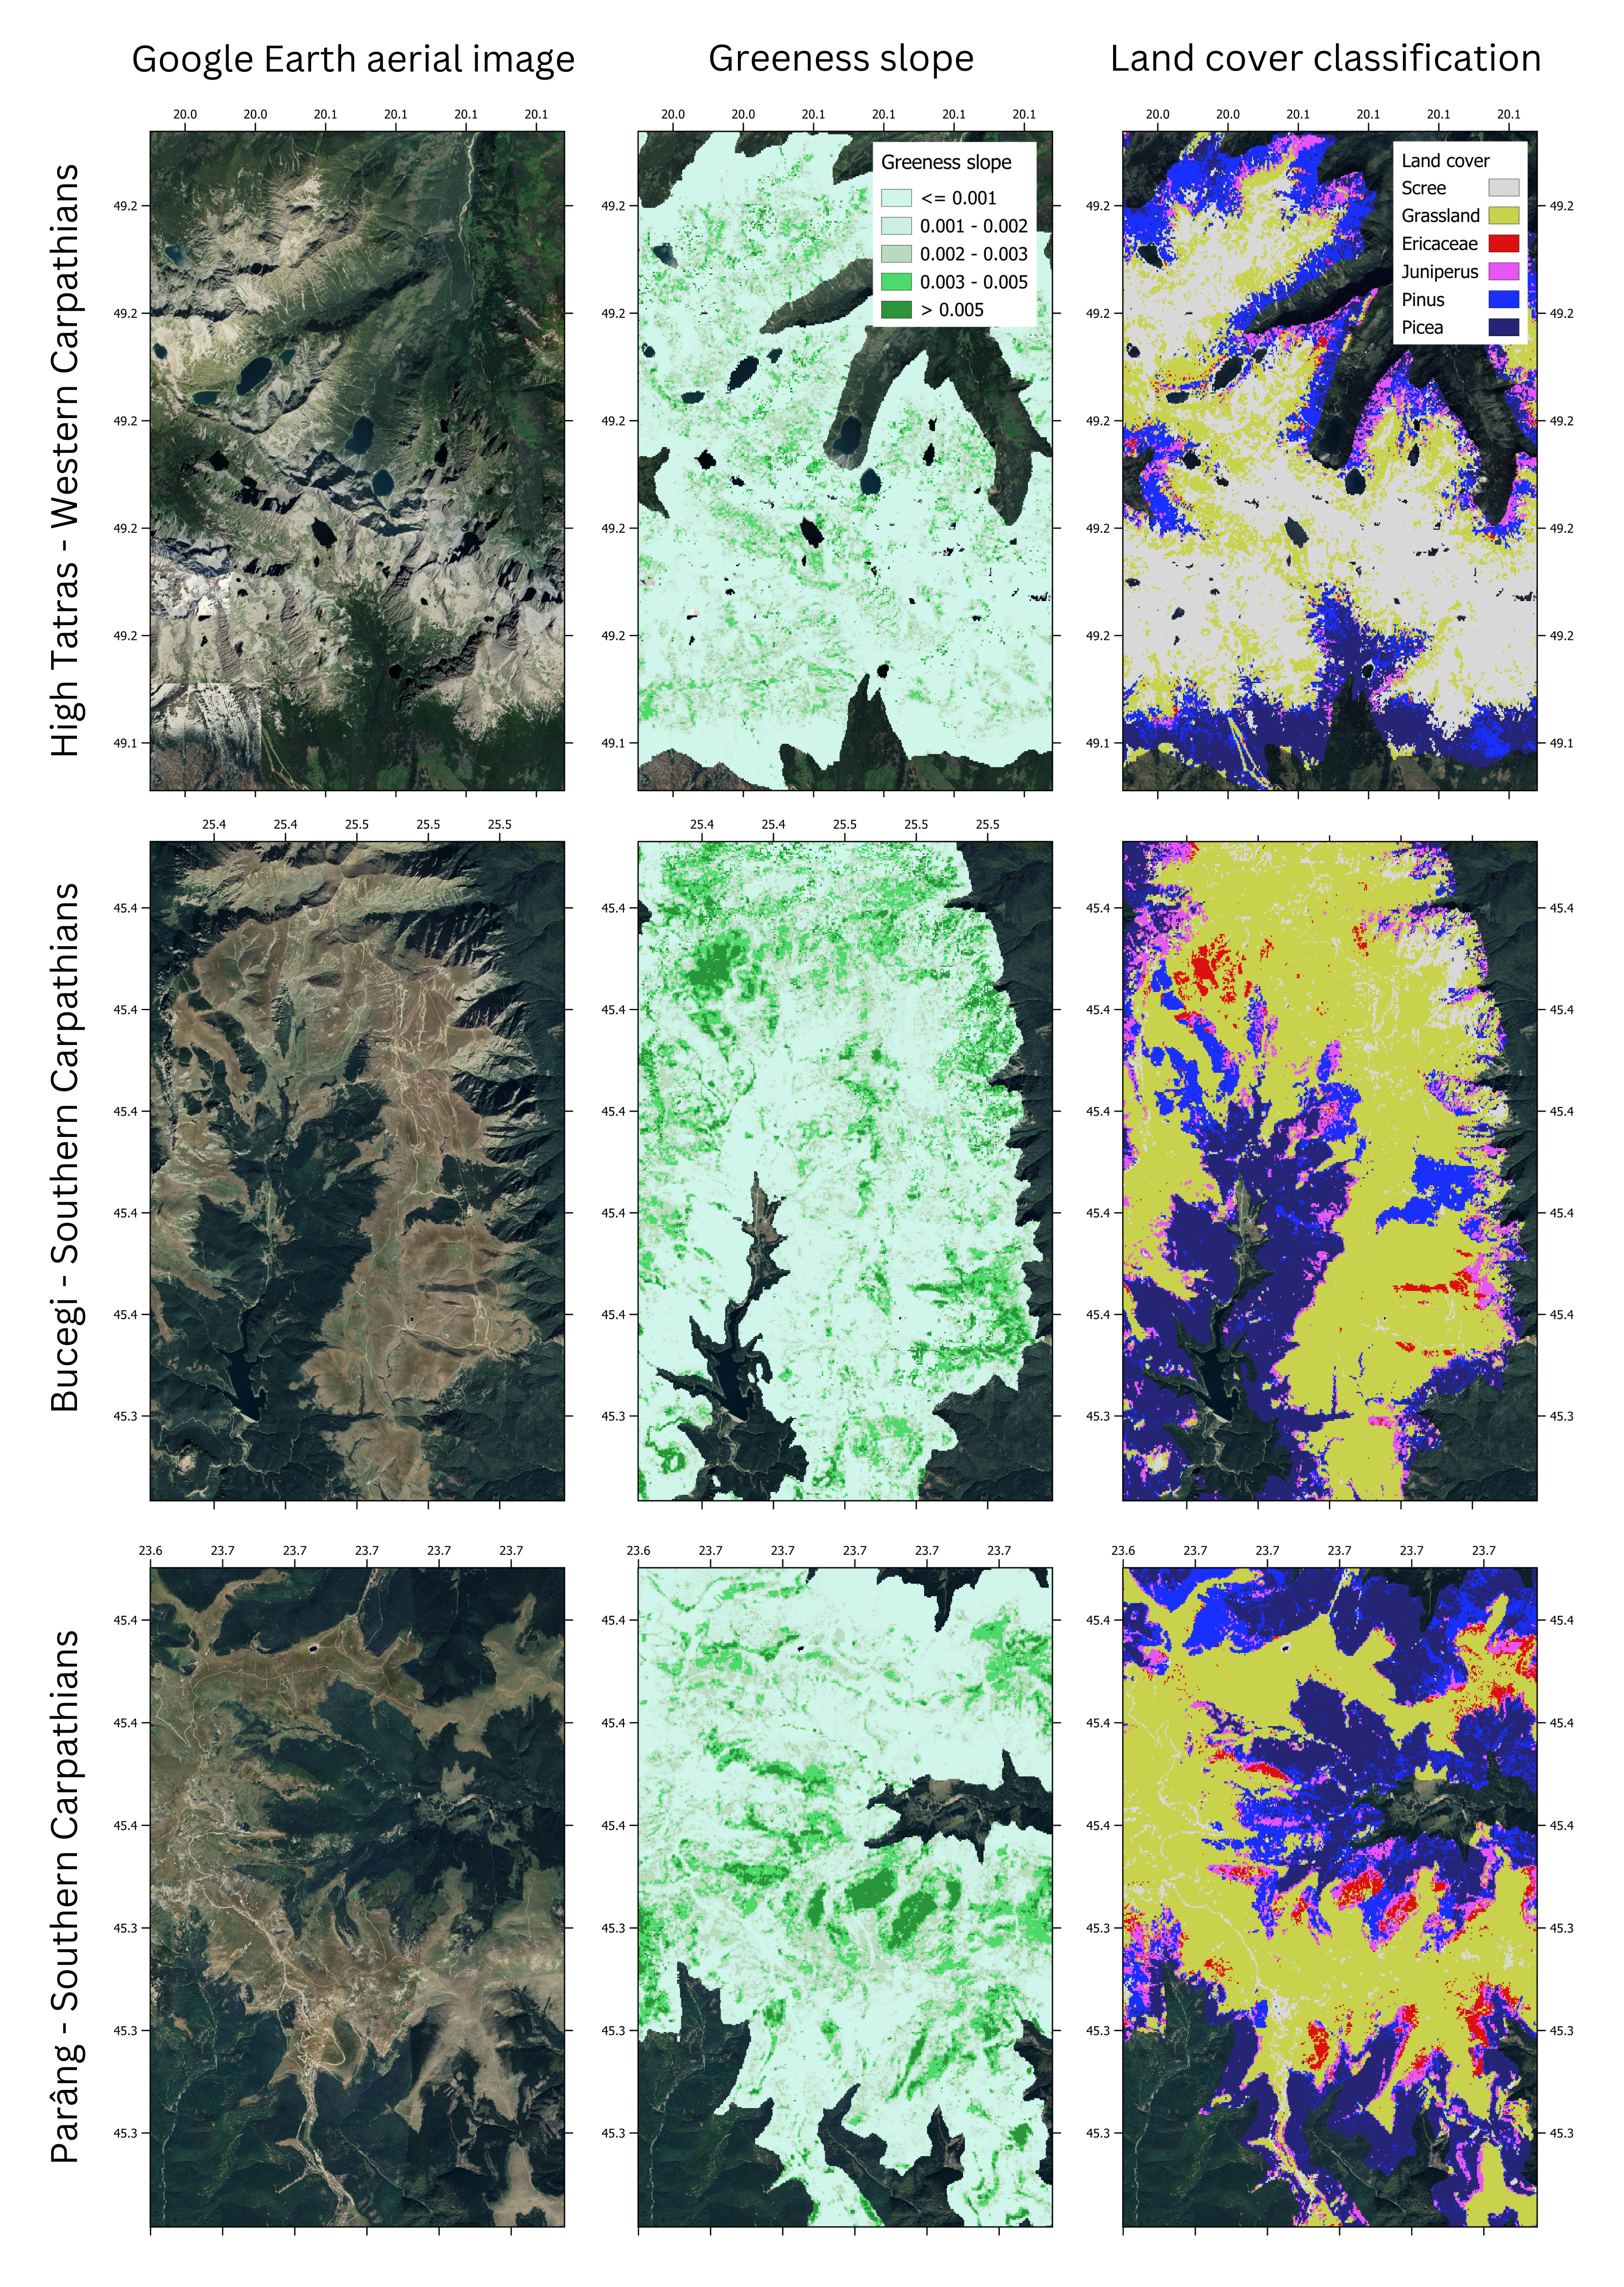
Example areas for detailed comparison of aerial imagery, greenness trends, and land cover.
Percentage cover of land cover types (x-axis) within each elevation range (y-axis) and Diurnal Anisotropic Heat Index category for all pixels across several mountain massifs (locations shown in figure 1). Land cover types are color-coded as in figure 3. The values on the bars represent NDVImax slopes, scaled by a factor of 1000, with values >3 shown in black.
ICE (Individual Conditional Expectation) plots showing the relationship between land cover probability and greenness slope.
Act. 1.3 – Exploring the effect of regional climate change
Work in progress.
Act. 1.4 – Investigating the role of microclimate
Work in progress.
Act. 1.5 – Evaluating the consequences of land use changes
Work in progress.
Phase 2 (2026) – Ecological processes of greening and consequences on mountain biodiversity
Act. 2.1 – Investigating shrub encroachment
Act. 2.2 – Evaluating the increase in shrubland density
Act. 2.3 – Studying the impact on plot-scale species diversity
Act. 2.4 – Assessing the consequences on landscape heterogeneity
